Plan the whole well test before rig-up.
Olimetra WTS solves the surface spread — choke, separators, lines, PSVs and flare — as one connected network, then writes the calculation report. Every result states the method that produced it.
Runs locally on Windows 10/11 and works offline after a one-time activation.
Wellhead
—psia
Temperature—
Gas rate—
Choke outlet
—°C
Hydrate temp.—
Bean—
Separator, 620 psia
—% gas cap.
Max. gas—
Gas retention—
Flare, 30 ft boom
—ft
Safe distanceK < 1,500
Flame length—
Heat release—
Demo well: 13-component composition with a C7+ pseudo-component, 36 in × 10 ft horizontal separator, 10 mph wind. Wellhead pressure falls as the choke opens, as it does in a real test. Values come from the same solver the licensed software runs; they change with every input.
Read the whole test on one diagram
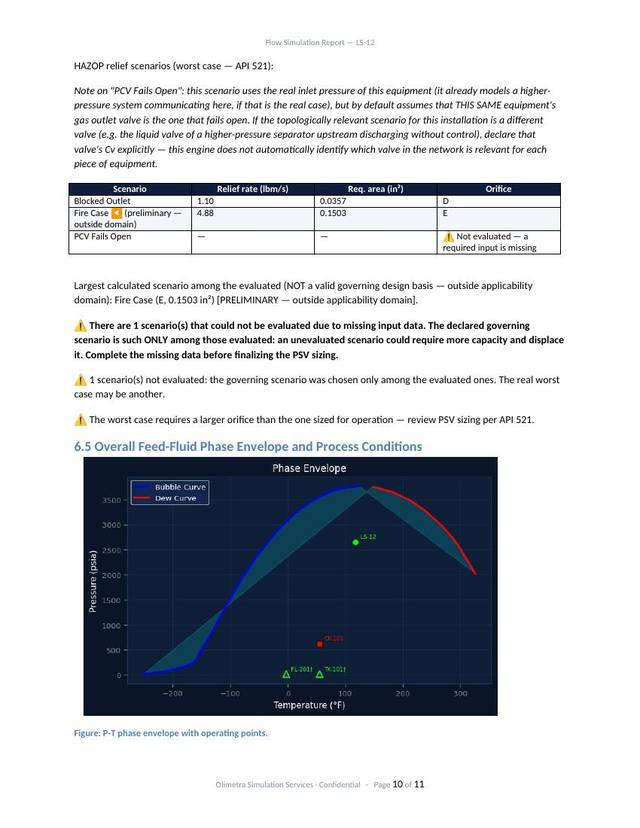
The engine traces the fluid's phase envelope with the same flash it uses for every other result, then places each flow period on it, next to the hydrate curve. Where the choke outlet lands tells you what the period needs.
Across the choke
Against the hydrate curve
What isn't drawn is marked
Near the critical point the flash cannot resolve the boundary, so that stretch is drawn dashed instead of invented. The cricondentherm and cricondenbar are computed, not estimated.
The report is part of the product
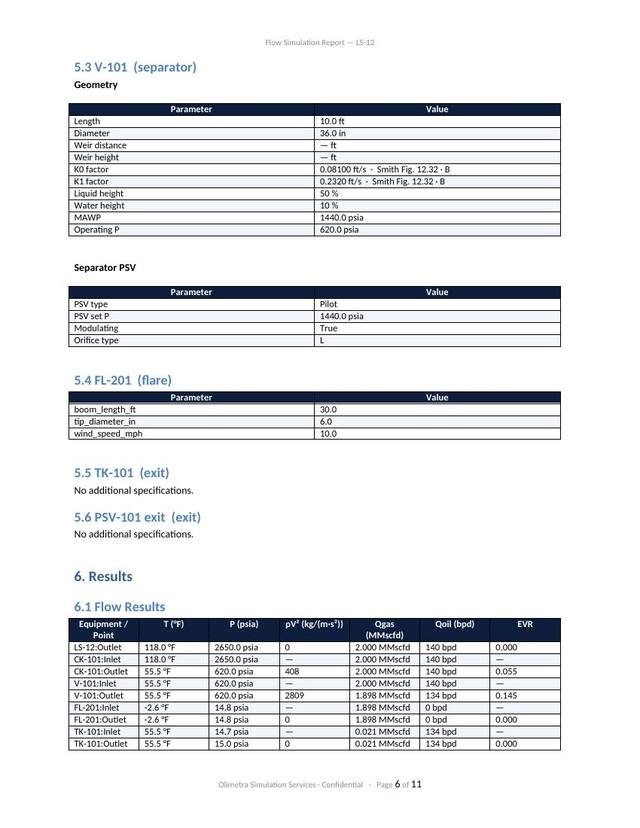
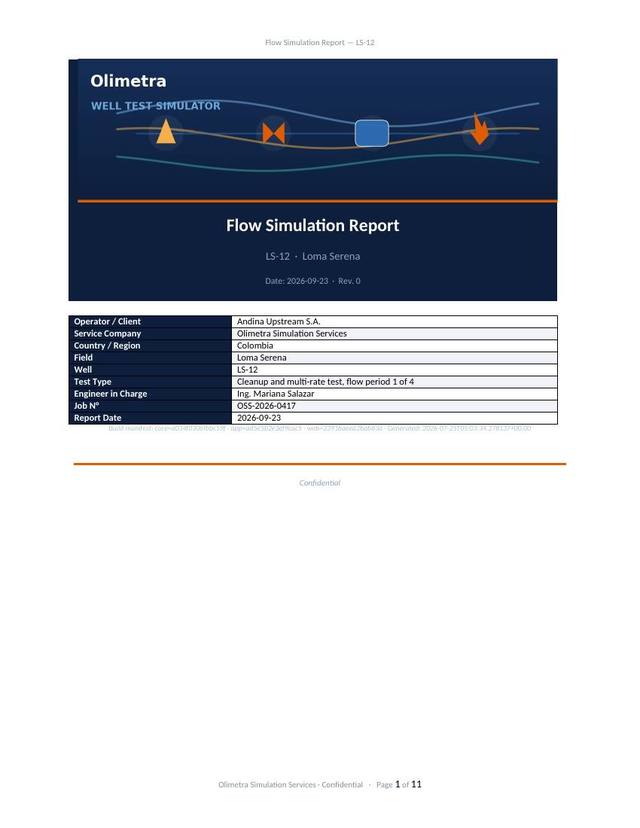
These are real pages, generated for the demo well above in one click. No retyping results into a template.
- Every node, every alarm, with the inputs that produced them and the method behind each number.
- PSV data sheets, radiation heatmaps and the phase envelope, rendered from the same calculation.
- English, Spanish, French or Portuguese, chosen per report.
Well test design is one connected problem. Most tools treat it as five separate ones.
Spreadsheets don't propagate
A new wellhead pressure means editing the choke, separator, line and flare files by hand. The errors that cost rig time live in the copy between them.
Plant simulators weren't built for this
General-purpose process simulators cost USD 30–50k a year and weeks of training — for a calculation the field needs in half an hour.
The report takes longer than the math
Compiling results, alarms, PSV sizing and the flare safety zone into a document the client will accept takes hours after every design.
Every number shows its work
Each result carries the method that produced it. When a rigorous method can't run — no fluid composition, a condition outside its range — the software falls back to a simpler correlation and tells you which one and why, on screen and in the report. Nothing degrades silently.
Infeasible conditions are flagged, not hidden. A separator the upstream line can't reach, a fluid above its critical point during fire relief: the result is marked and so is everything that depends on it.
Independent code audits, with every finding tracked to a fix or a documented decision.
One network, from wellhead to flare
Build the spread node by node. A change anywhere propagates through every piece of equipment downstream in a single solve.
Flow and thermodynamics
- Peng-Robinson equation of state with C7+ characterization; phase envelope verified point by point against the same flash the solver uses.
- Choke in critical and subcritical two-phase flow, outlet temperature by rigorous isenthalpic flash, and an independent Gilbert cross-check. Sachdeva · Gilbert
- Multistage separation with the liquid composition carried from one stage to the next, not reset to the well stream.
- Multiphase lines, erosional velocity and elbow erosion. Beggs-Brill · API 14E · DNV-RP-O501
- Hydrates along the flow path, with MEG and methanol dosing and sour-gas correction.
Pressure relief and safety
- PSV and PRV sizing for gas, liquid and two-phase relief (direct integration and omega method), tabular back-pressure factor and the 3% inlet-loss rule. API 520 · API 526
- Relief scenarios — blocked outlet, control valve fails open, fire case — with the governing scenario identified.
- Separator capacity envelope and control-valve checks as a screening tool. API 12J · IEC 60534
- Knock-out drum sizing by terminal settling velocity, and ESD valve activation time screening. API 521
Radiation, noise and emissions
- Flare and air-atomized burner radiation with a finite-flame model near the flare, water screens and multi-source superposition. API 521 · Chamberlain
- Noise from chokes and valves, propagated outdoors and compared with exposure limits. IEC 60534-8-3 · ISO 9613-2 · OSHA 1910.95
- CO₂e and SO₂ for flared and vented gas. 40 CFR Part 98 · EPA Method 19
Reports and data
- Calculation report in Word, generated in one click, in four languages, with heatmaps, PSV data sheets and the method behind each result.
- AI copilot that builds the flow diagram from a plain-language description and reviews results for out-of-range equipment.
- Gas metering by orifice plate and wet-gas Venturi. AGA-3 · ISO 5167
- Professional tier: Monte Carlo (P10/P50/P90), live recalculation with field data by CSV, full GHG inventory (Scope 1–3), advanced HAZOP and permit to work.
Checked against field reports, not against itself
Correlations are compared with measured data and reference simulator reports. Where a method has limits, the report says so.
Separator gas capacity
2.1% max deviation
9 cases between 240 and 900 psia, RMS deviation 1.1%.
Choke extra pressure drop
8.1% mean error
7 cases, with a consistently conservative bias.
Choke outlet temperature
1.3 °C
Reference case, rigorous flash. The simplified lumped method missed by 5.3 °C.
Standards and methods behind the calculations
From fluid composition to report
Define the fluid
Enter the molar composition, or gas gravity and API when that's all you have. The software tells you which results that limits.
Build the spread
Place the choke manifold, separators, heaters, lines, tanks and flare, and connect them as they'll be rigged up.
Solve every flow period
Pressures, temperatures, hydrate margins, relief and radiation for each period, with alarms where equipment runs out of range.
Deliver the report
A Word calculation document ready for the operator, in the language the client works in.
One product, three capability levels
Annual license, installed on your machine. Simulation data never leaves it.
Available now
Core
For well testing companies and oilfield service firms
USD 2,900 / year
Regular price USD 3,900 / year
Introductory price, save USD 1,000- Connected network simulation, 20+ equipment types
- PSV / PRV sizing, gas, liquid and two-phase (API 520/526)
- Choke two-phase flow, PR-EOS outlet temperature, hydrates and inhibitor dose
- Flare and burner radiation with near-field model (API 521)
- Noise with ISO 9613-2 propagation and OSHA exposure limits
- CO₂e and SO₂ emissions (40 CFR Part 98 / EPA Method 19)
- Knock-out drum, separator capacity envelope, phase envelope
- Relief scenarios (basic HAZOP) and batch sensitivity runs
- AI copilot and automatic Word report in 4 languages
Available now
Professional
For operators and engineering teams that approve well test designs
USD 11,900 / year
- Everything in Core, plus
- Monte Carlo analysis (P10 / P50 / P90)
- Live recalculation with field data by CSV
- Full GHG inventory, Scope 1–3
- Advanced HAZOP with custom scenarios
- HSE and automatic permit to work
Coming soon
Enterprise
For operators running several projects with distributed teams
USD 34,900 / year
- Everything in Professional, plus
- IPR and nodal analysis
- Multiple users with roles and permissions
- Browser access, no installation
- SCADA / OPC integration and REST API
- Dedicated onboarding and support
In development, Q1 2027
Prices in USD, billed annually. One license covers one machine. Cancel anytime.
Rather not run the software? We'll run it for you.
Send the well data. We simulate, review and deliver the same technical report the licensed software produces, with no installation or learning curve.
Quick analysis
USD 195
24-hour turnaround
- Choke outlet temperature and hydrate risk
- One separator sizing
- Flare radiation safety zones
- PDF summary report
Full well test package
USD 450
48-hour turnaround, most requested
- Full network: choke, separators and PSV
- Flare and burner radiation heatmaps
- Knock-out drum, CO₂e and SO₂
- Noise levels and hydrate assessment
- Full Word technical report
Campaign support
USD 1,200 / month
Priority 12-hour turnaround
- Up to 8 simulations a month
- All analyses included
- Design iterations and sensitivity runs
- Direct support by WhatsApp or Teams
Ready to request a simulation?The well test data sheet takes about 8 minutes.
Fill in the data sheetCatch the hydrate risk before the crew is on location
Install, activate and solve your first spread in under ten minutes.
Built by engineers, for engineers
Olimetra WTS was developed by petroleum engineers with hands-on experience in well testing operations across multiple basins. For years we relied on disconnected spreadsheets and expensive general-purpose simulators that were never designed for what the field actually needs.
We built it because no tool combined rigorous thermodynamics, safety analysis and automatic documentation in one affordable platform made for well testing engineers.
Any basin
Validated against real well data from several basins, following API and international standards used from the Gulf of Mexico to the Middle East.
Field-checked, not theoretical
Results benchmarked against reference simulator reports on real wells.
Made for well testing
Not adapted from a plant simulator. Every calculation is designed around the well test workflow.